Bitcoin Slumps Amid FOMC Anticipation, Eyes Support Levels
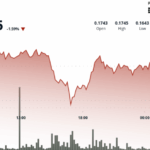
Bitcoin (BTC) experienced a sharp drop of approximately $103,500, trading around $103,300 late Tuesday, as traders cut back risk ahead of the Federal Open Market Committee’s (FOMC) crucial interest rate decision scheduled for release Wednesday.
Price Correction Followed by Bearish Weekly Close
The recent pullback follows a bearish weekly candle close, raising speculation about potential trend reversal. Geopolitical tensions, particularly the ongoing Israel-Iran conflict, further contributed to the risk-off sentiment.
Decline Driven by Leverage and Shift in Profit-Taking
Market data points indicate the sell-off isn’t purely macro-driven. It aligns with seasonal weakness and declining on-chain network growth, suggesting cooling spot demand.
Approximately $434 million in BTC futures were liquidated in the preceding 24 hours, highlighting that the move is largely leverage-driven, with traders opting for caution. This contrasts with the positive trend seen in the Bitcoin Coinbase Premium Index, which has remained positive for most of June, indicating underlying spot demand. However, this demand’s impact on price has been limited.
Mid-Term Holders Realize Significant Profits
Significant profit-taking pressure arrived Monday from “mid-cycle holders” (holding 6-12 months), who cashed in $904 million. This cohort accounted for 83% of total realized gains—a notable shift from longer-term holders who previously led profit realization. The rotation suggests changing market dynamics.
Long-Term Holder Behavior Points to Caution
Despite the mid-term profit-taking, long-term investor behavior presents a mixed picture. Bitcoin researcher Axel Adler Jr noted that long-term holders (LTHs) are still refraining from large-scale spending, a pattern historically associated with bullish markets.
Technical View: Potential Short-Term Bottom Around $102K?
Technical analysis suggests Bitcoin may be approaching a short-term bottom between $102,000 and $104,000, where dense liquidity and a historical order block intersect.
Bollinger Bands are contracting, signaling an imminent volatility event. A potential faster bounce from the $102,000 area could occur due to proximity to the middle band (~$106,000 dynamic resistance). A successful reclaim above ~$106,748 could validate a mean reversion towards $112,000. Conversely, a clean break below $100,000 could signal a breakdown, targeting $98,000. Support at $98,300 remains critical for short-term holders’ profitability.
Disclaimer: This analysis does not constitute investment advice. Trading cryptocurrencies involves significant risk.


