Bitcoin Analysis: Market Not Overheated Despite New All-Time High
July 14, 2025 | 4:57 PM GMT
Key Takeaways
- Bitcoin reached a new all-time high of approximately $123,000 this week, but on-chain data suggests the market shows no signs of overheating, pointing to continued growth potential.
- Analysts maintain that Bitcoin has not hit its peak yet, with metrics indicating favorable conditions for further price appreciation.
- Key resistance levels include $124,000–$136,000, while support zones are situated around $113,000–$111,000–$101,000.
Bitcoin Market Not Showing Signs Of Overheating
Despite Bitcoin reaching new all-time highs of around $123,000 on Friday, analysts suggest the market is not overheating. On-chain metrics are providing mixed signals about whether this rally is sustainable.
Understanding The Bitcoin Peak Signal
According to CryptoQuant analyst Axel Adler Jr., Bitcoin has yet to reach its peak range. The firm’s “peak signal” indicator—a combination of market price-to-realized price metrics—is not triggering at current price levels
“The Peak Signal only appears at major market tops, and it hasn’t shown up this time, suggesting we’re not at a peak yet,” Adler explained.
Realized Cap-UTXO Age Bands Show Cooling Effect
The realized Cap-UTXO Age Bands metric shows significantly reduced signs of overheating compared to previous major tops:
- During March 2024 and December 2024 peaks, the 1-day to 1-week holding period UTXO represented 14% of the realized cap
- Currently, this figure stands at approximately 5% despite the recent all-time high
CryptoQuant analyst Dan wrote:
“Despite the price rising even higher, the fact that overheating has significantly decreased compared to previous short-term peaks suggests that Bitcoin could continue to break all-time highs and rise significantly in the second half of 2025.”
Market Metrics Point To Continued Growth Potential
Additional metrics supporting potential continuation of the bullish trend include:
- Bitcoin’s MVRV Z-Score remains well below historical peak levels
- Cointelegraph Markets Pro/TradingView analysis shows BTC has established a new range on lower timeframes
On-Chain Data Reveals Key Bitcoin Levels
CryptoQuant analysts have identified crucial price levels based on Short-Term Holder (STH) cost basis:
Resistance Levels
- $124,000: Average cost basis (plus 1 standard deviation) for STHs
- $136,000: 30-day holder cost basis (plus 1 standard deviation)
Solid Support Levels
- $113,000: 0.5 standard deviation above STH realized price
- $111,000: Average cost basis for holders who acquired BTC in the past month
- $101,000: Baseline STH realized price (most important medium-term support)
- $107,500: Bottom of the MVRV +0.5 standard deviation band
Technical Indicators & Price Action
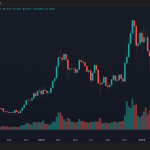
The current market structure shows Bitcoin must reclaim the $119,250–$120,700 zone to sustain bullish momentum. On the downside, the 200-day exponential moving average (EMA) is providing dynamic support between $113,700 and $115,300.
This article does not contain investment advice or recommendations. Every investment and trading move involves risk, and readers should conduct their own research when making a decision.


