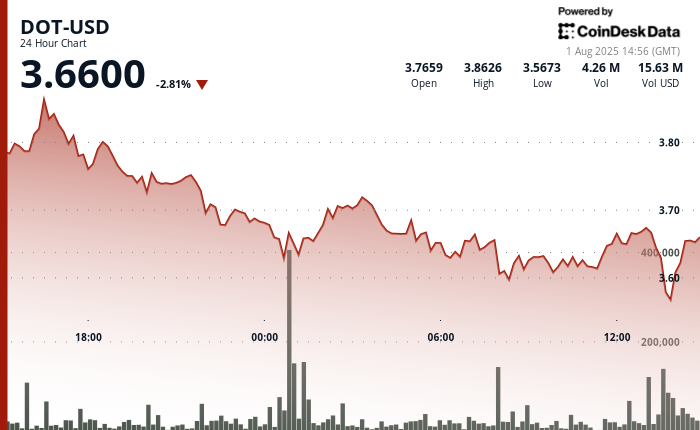
The model showed that DOT initially demonstrated resilience, achieving an intraday high of $3.87 on July 31, yet subsequently confronted relentless selling pressure accompanied by pronounced volume surges during pivotal breakdown junctures on August 1.
The token now has support in the $3.55-$3.58 range, with resistance at the $3.68 level, according to the model.
In recent trading, DOT was 5.3% lower over 24 hours, trading around $3.64.
Technical Analysis:
- Price retreated from $3.76 to $3.56, representing a 5% decline over 24 hours.
- Intraday peak reached at $3.87 at 16:00 UTC on July 31 before selling pressure intensified.
- Volume exceeded 24-hour average of 3 million during key breakdown periods.
- Substantial resistance confirmed at $3.68 level.
- Fresh support established around $3.55-$3.58 range.
- Critical support breach occurred at $3.60 during final hour decline.
- New resistance formed around $3.67 level.
- Volume spikes exceeded 200,000 units during 13:45-13:46 UTC and 13:54 UTC periods.
- Negligible trading activity recorded in final three minutes, suggesting market exhaustion.


