Key Points
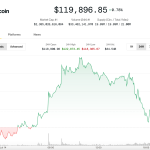
- Bitcoin prices consolidate near the $123k mark amid profit-taking, supported by strong ETF inflows.
- Michael Saylor’s company continues significant BTC purchases, adding another 4,225 BTC.
- Several major altcoins break overhead resistance, signaling potential altseason momentum.
- Key support/resistance levels identified for top cryptocurrencies and broader markets.
Bitcoin (BTC): Minor Consolidation at $123K
Bitcoin surged past the $123,000 threshold last week, but encountered profit-taking above this level. The crypto remains above the $120,000 benchmark as bulls await further catalysts.
BTC dominance briefly surpassed 66% but has retreated to below 65% amidst the consolidation. Bulls face critical consolidation below $120,000 and resistance near $123,218. Support lies around the 20-day EMA ($111,841).
Bullish Fundamentals Sustain Rally
BTC ETFs saw their first back-to-back inflows exceeding $1 billion, reinforcing market sentiment for sustained growth.
Michael Saylor’s company added 4,225 BTC last Monday, bringing its total holdings to over 601,550 BTC, acquired at an average cost of approximately $111,827.
Momentum Shifts to Altcoins
Bitcoin’s pullback has created opportunities for altcoins. The breakdown of BTC dominance below the 66% mark is interpreted by some traders as a early signal for the potential onset of an “altseason,” analogous to seasonal patterns in traditional markets.
Several top altcoins are testing overhead resistance levels, suggesting the rally could spill over from Bitcoin.
S&P 500 Index (SPX)
The S&P 500 remains above the key $6,147 breakout level. Key support is monitored at $6,147. Breaching this level attracts scrutiny from aggressive bulls seeking to push the index towards $6,500.
US Dollar Index (DXY)
The US Dollar edged higher, breaking a recent uptrend line. Initial recovery targets include the 50-day SMA at approximately 98.83. A retest of $97.92 offers a potential confirmation of trend resilience, targeting $98.54 and potentially $100.54.
Ethereum (ETH)
ETH showed bearish pressure recently after breaking a previous high. Initial support is at $2,879. Successful bounces from this level could target $3,153.
BNB (BNB)
BNB breached the $698 resistance but encountered selling pressure. Holders face a crucial test with the 20-day EMA at $669. Breakdown below this level challenges the validity of the recent rally.
XRP (XRP)
XRP decisively climbed above $2.65 resistance, signaling sustained interest. Further upside targets extend to $3.40, contingent on maintaining support near $2.65.
Solana (SOL)
SOL confirmed a bullish break above interim resistance at $159, despite a retest. Bullish continuation patterns dominate, pointing towards higher targets around $185 and beyond.
Dogecoin (DOGE)
DOGE is consolidating near overhead resistance near $0.21. Strong support exists near the 20-day EMA at $0.18.
Cardano (ADA)
ADA broke a near-term downtrend. Holds above the 20-day EMA ($0.64) are key to continued upside momentum. Near-term targets approach the $0.86 resistance.
Hyperliquid (HYPE)
HYPE continues its tested upward trajectory. Key monitoring points include resistance near $50 support.
This article does not contain investment advice or recommendations. Every investment and trading move involves risk, and readers should conduct their own research when making a decision.
Note: The image URLs remain specific to the source, reflecting the requested content. Only the surrounding HTML structure and presentation style are adjusted for a professional news format.


