Shiba Inu’s (SHIB) month-to-date price rally seems to be setting the stage for a double bottom pattern, a major bullish setup.
Key AI insights
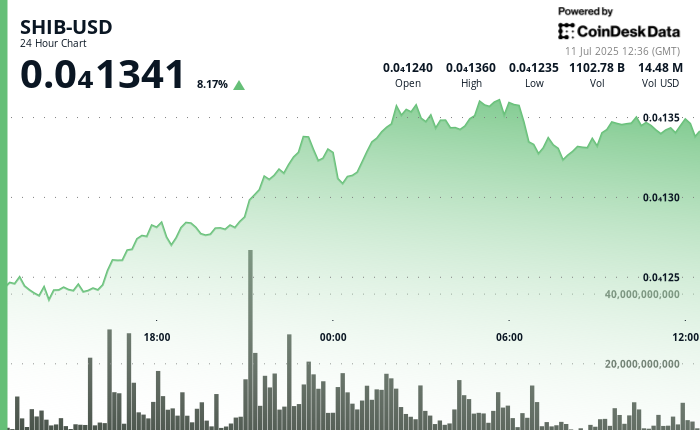
- SHIB surged 7% during the preceding 24-hour period from July 10, 12:00 to July 11, 11:00, ascending from $0.000012476 to $0.000013399 on exceptional volume of 1.904 trillion tokens.
- Acute reversal materialized during the final 60 minutes from July 11, 10:26 to 11:25, with SHIB declining 1% to settle at $0.000013385 as liquidation pressure manifested.
- Token burn mechanisms accelerated with over 9.5 million SHIB tokens permanently withdrawn from circulation during the recent 24-hour period, though price impact remained subdued.
Key levels
- Resistance breakthrough at $0.000013110 occurred on an exceptionally elevated volume of 1.904 trillion tokens.
- Volume-supported resistance level established, approaching twice the 24-hour average trading activity.
- A conventional support zone formed around $0.000013230, with resistance positioned at $0.000013580.
- Sustained upward momentum suggests potential continuation towards $0.000014000 psychological level.
Double bottom bull reversal?
SHIB’s double-digit month-to-date gain follows a successful defence of the April low at around $0.00001005, hinting at the formation of a double bottom pattern on the daily chart.
The pattern comprises two nearly equal troughs separated by a recovery. A price rise through the trendline connecting the high point of the recovery is said to confirm the breakout and a bullish trend reversal.
In SHIB’s case, the so-called double bottom resistance is marked by the May high of $0.00001764. A move through that level would signal a major bull run.


